This function transforms the current numeric vector or intensity data
set into a "simplified black and white image" of this same data set: every
value of disease intensity below and above a given threshold is given the
value 0 and 1, respectively.
Arguments
- data
A numeric vector or an
intensityobject.- value
All the intensity values lower or equal to this value are set to 0. The other values are set to 1.
- ...
Additional arguments to be passed to other methods.
Value
A numeric vector or an intensity object.
Details
By default, everything above 0 is given 1, and 0 stays at 0. threshold
is thus useful to report a whole sampling unit as "healthy" (0), if no
diseased individual at all was found within the sampling unit, or "diseased"
(1) if at least one diseased individual was found.
Examples
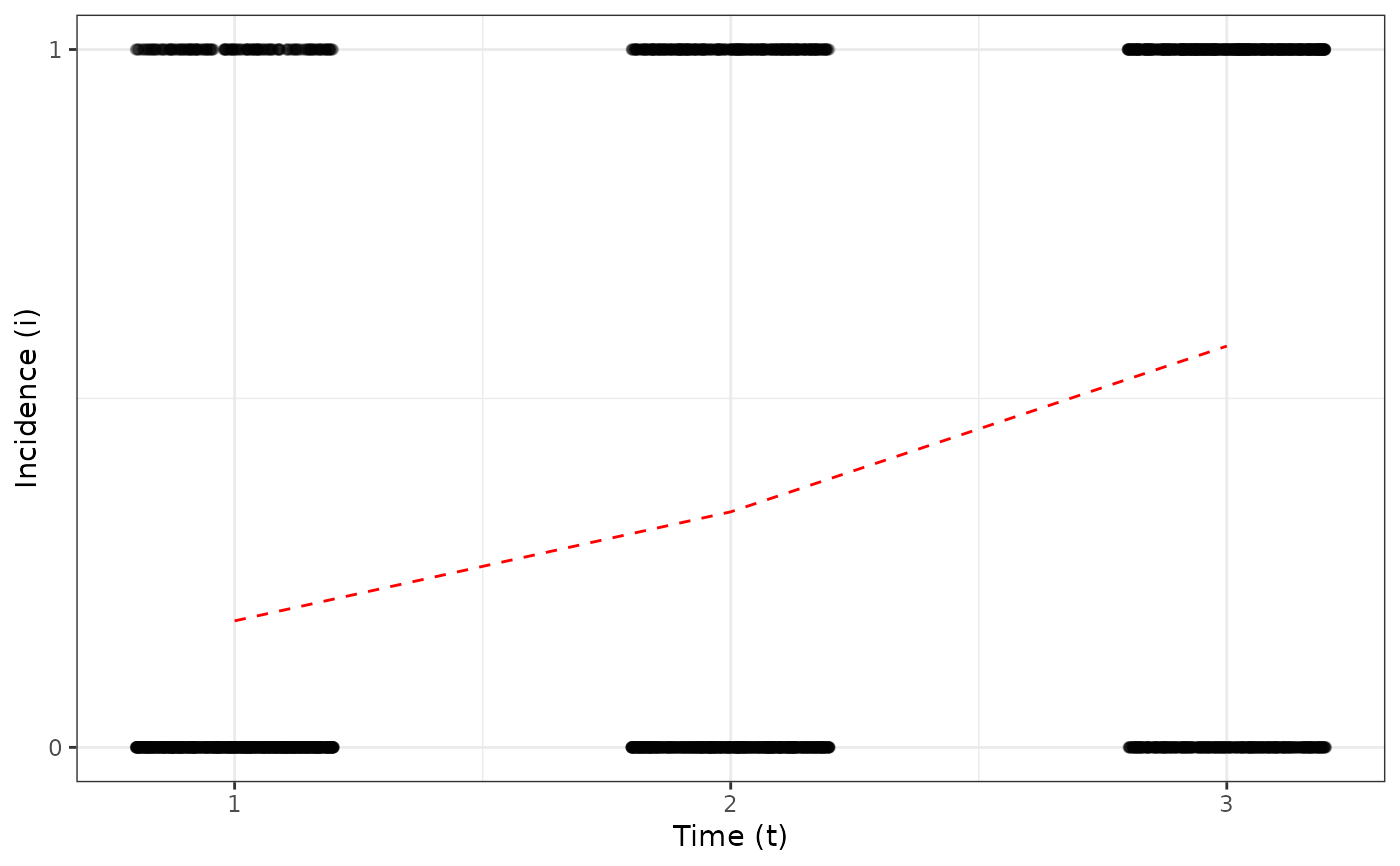
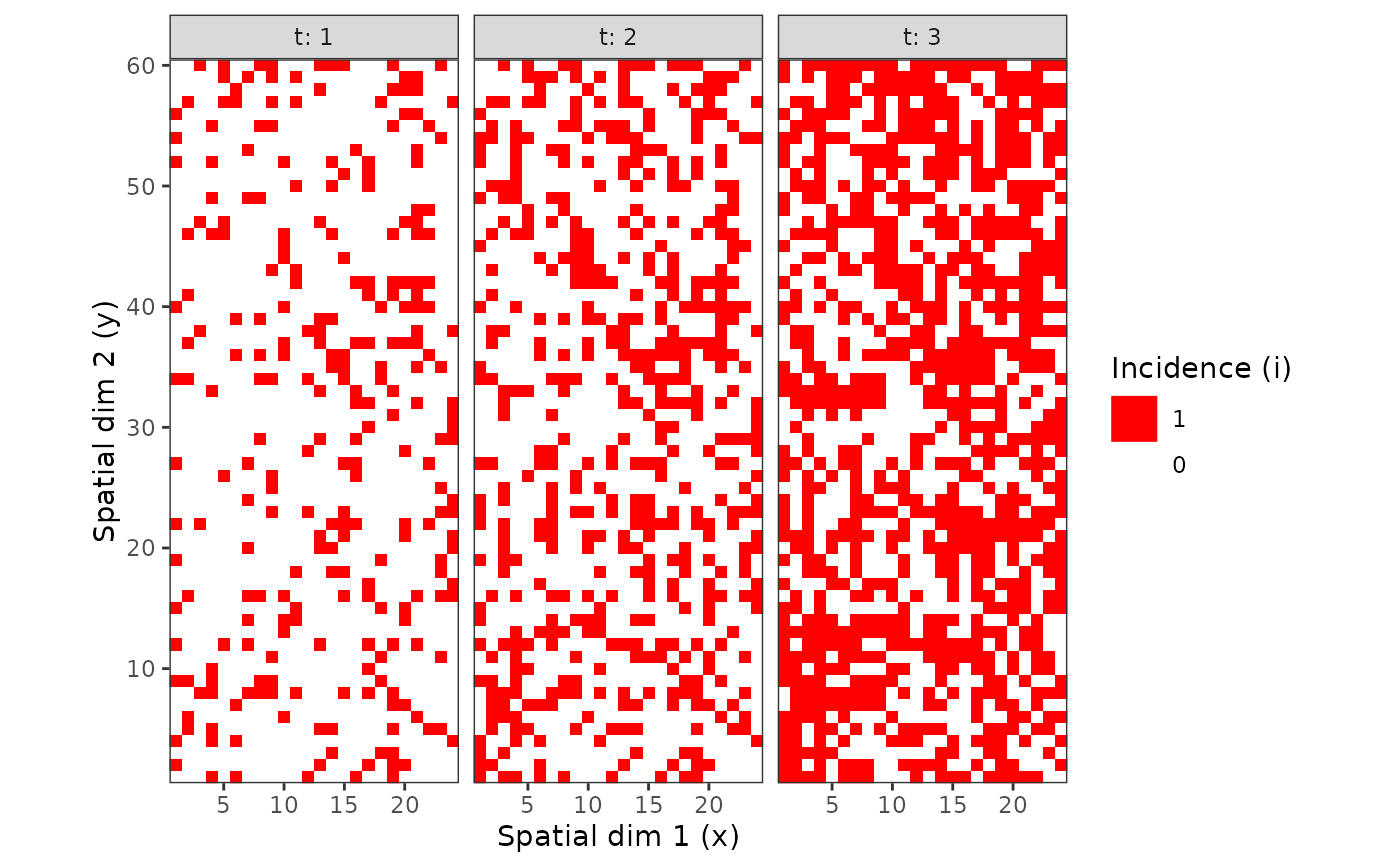
my_incidence <- incidence(tomato_tswv$field_1929)
plot(my_incidence, type = "all")
#> Warning: Computation failed in `stat_summary()`
#> Caused by error in `get()`:
#> ! object 'mean_sdl' of mode 'function' was not found
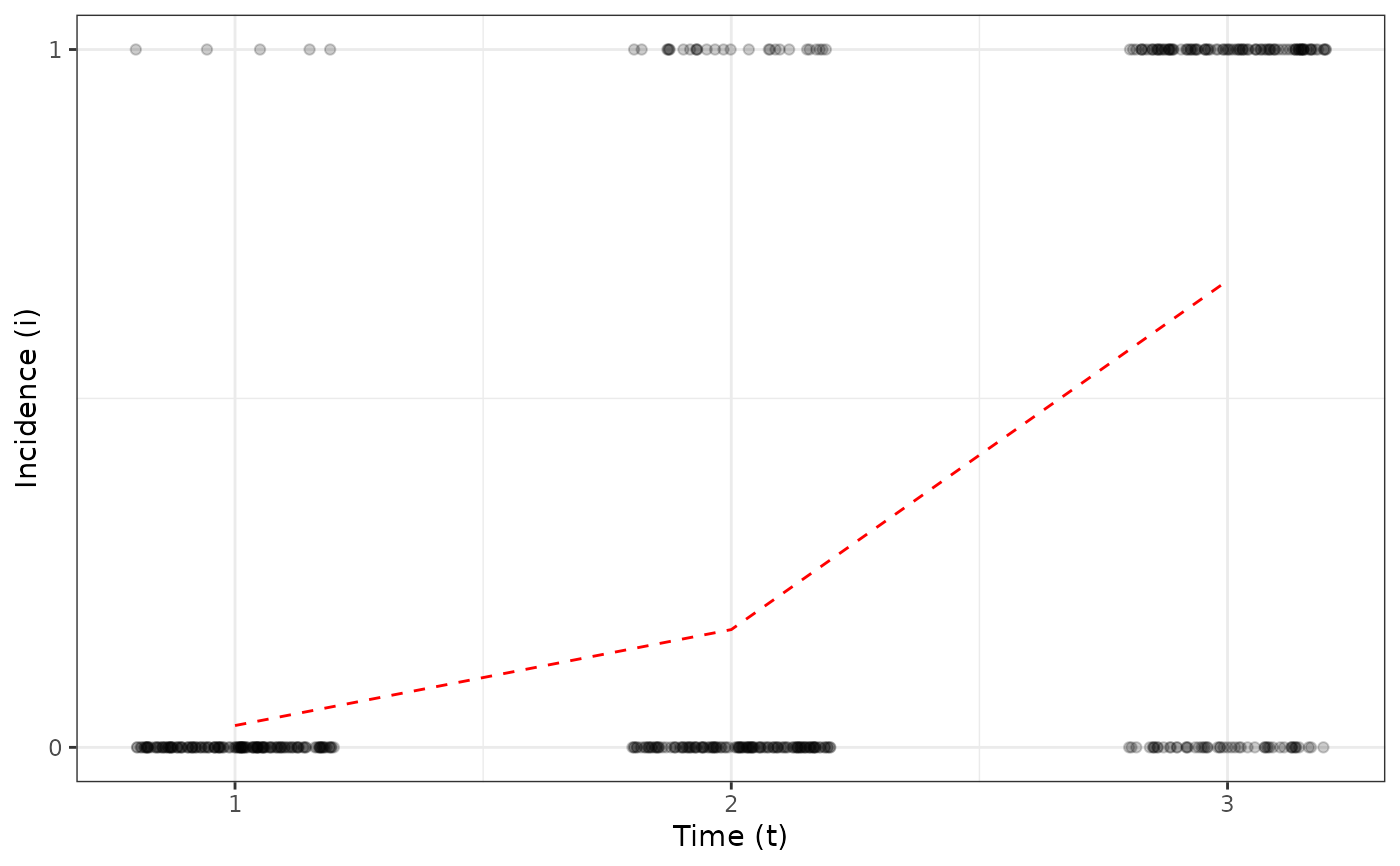
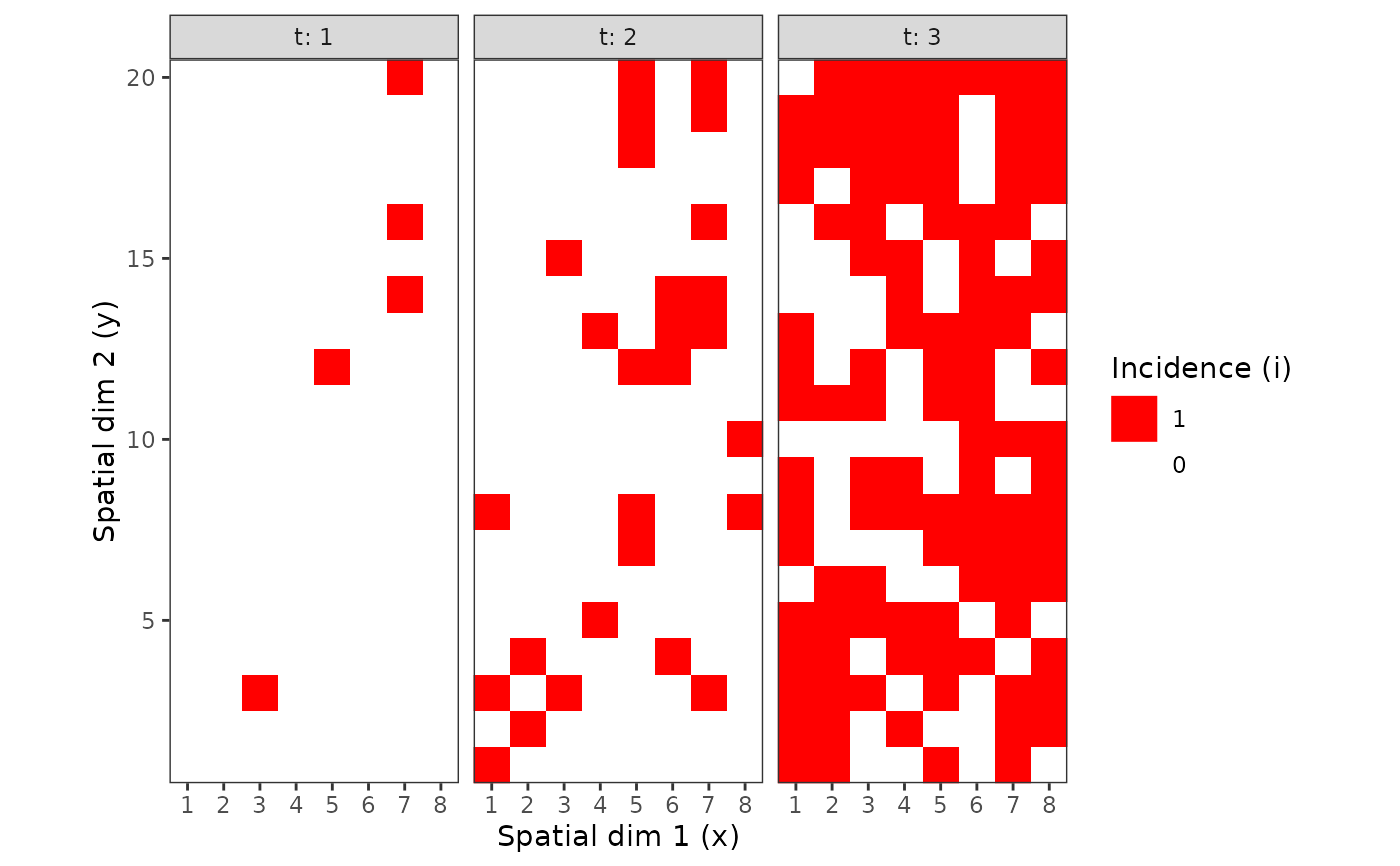
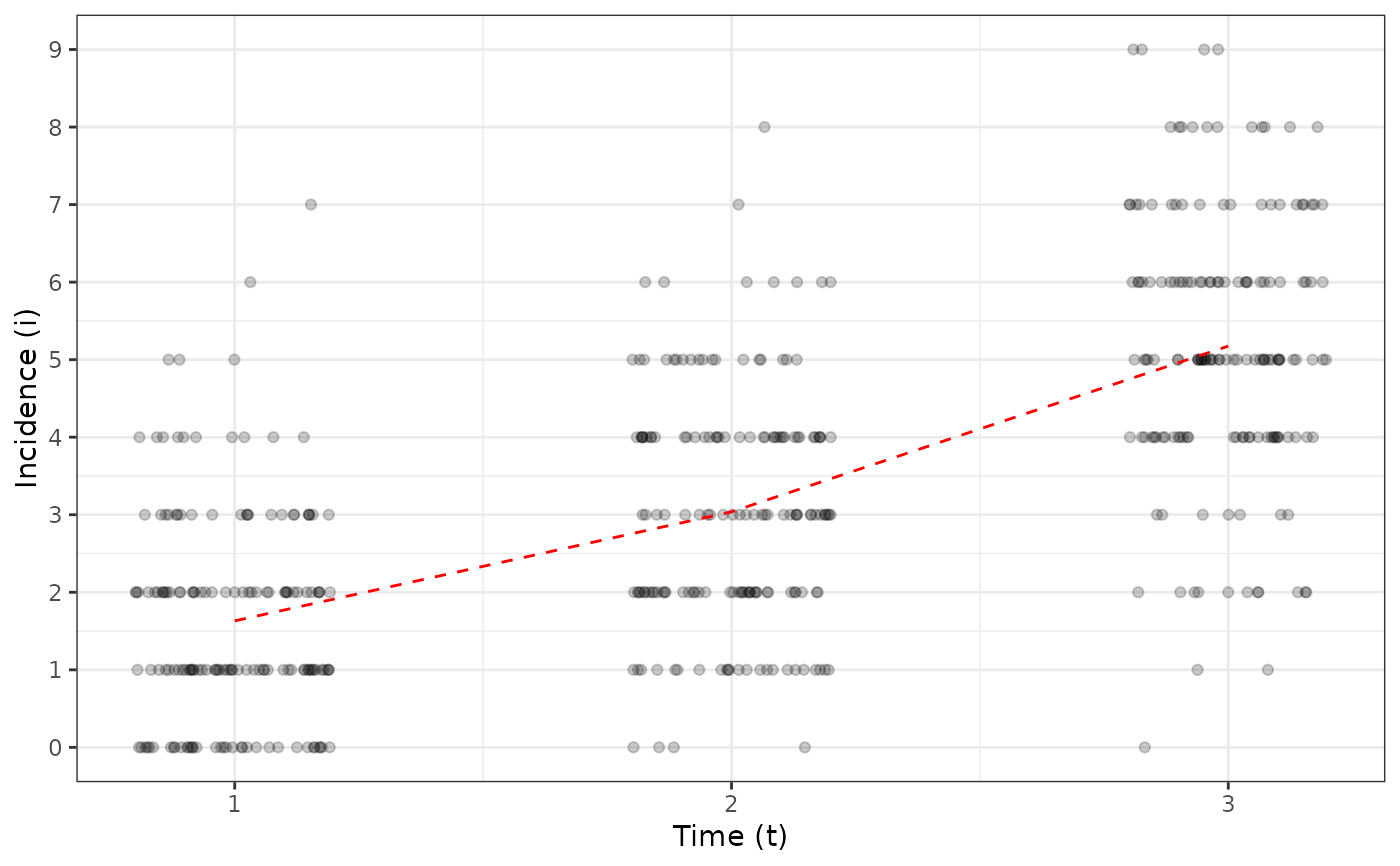
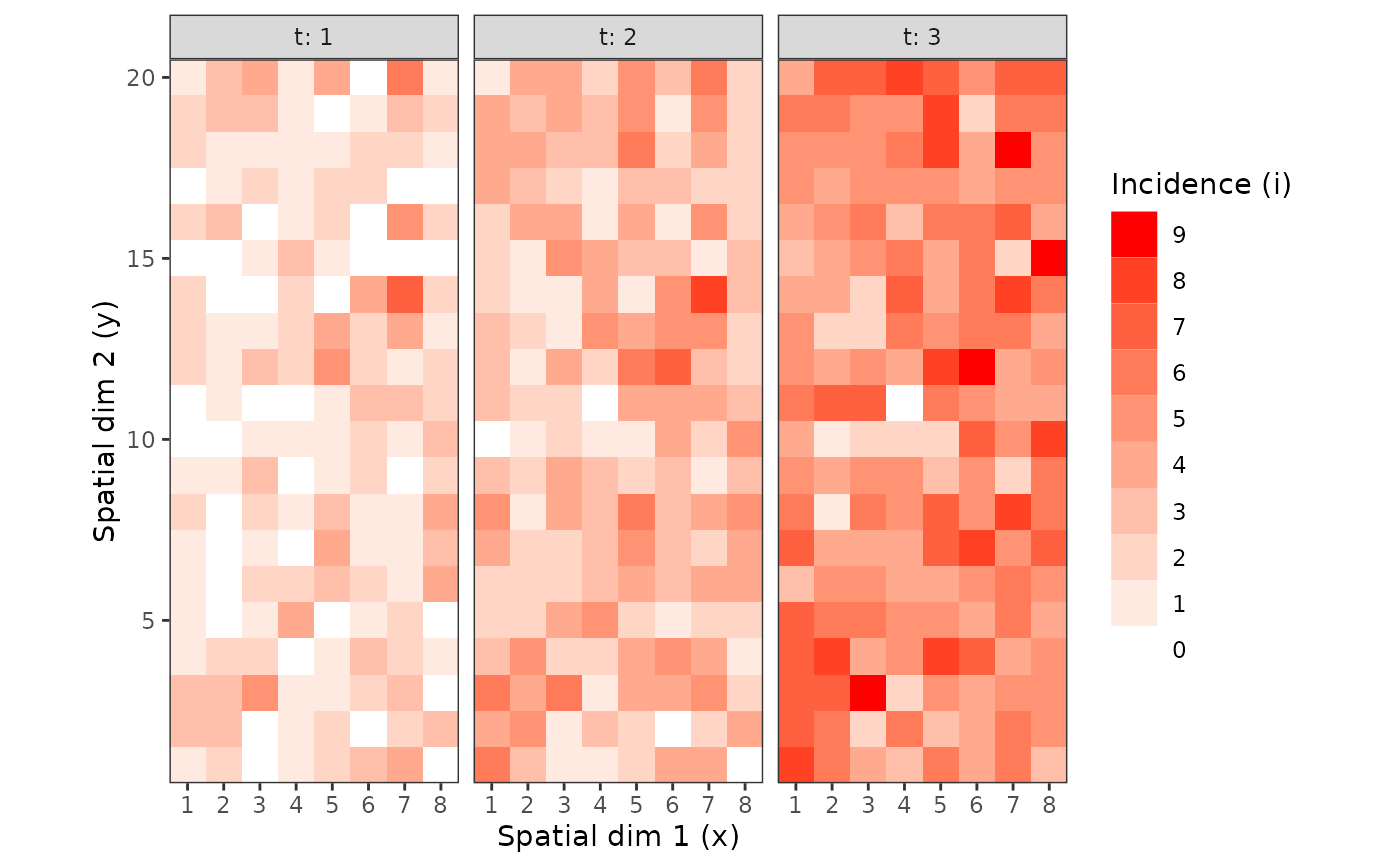
 my_incidence_clumped_1 <- clump(my_incidence, unit_size = c(x = 3, y = 3))
plot(my_incidence_clumped_1, type = "all")
#> Warning: Computation failed in `stat_summary()`
#> Caused by error in `get()`:
#> ! object 'mean_sdl' of mode 'function' was not found
my_incidence_clumped_1 <- clump(my_incidence, unit_size = c(x = 3, y = 3))
plot(my_incidence_clumped_1, type = "all")
#> Warning: Computation failed in `stat_summary()`
#> Caused by error in `get()`:
#> ! object 'mean_sdl' of mode 'function' was not found
 my_incidence_thr <- threshold(my_incidence_clumped_1, value = 4)
plot(my_incidence_thr, type = "all")
#> Warning: Computation failed in `stat_summary()`
#> Caused by error in `get()`:
#> ! object 'mean_sdl' of mode 'function' was not found
my_incidence_thr <- threshold(my_incidence_clumped_1, value = 4)
plot(my_incidence_thr, type = "all")
#> Warning: Computation failed in `stat_summary()`
#> Caused by error in `get()`:
#> ! object 'mean_sdl' of mode 'function' was not found